مجموعه آموزش آنالیز کوواریانس یک طرفه One-way ANCOVA
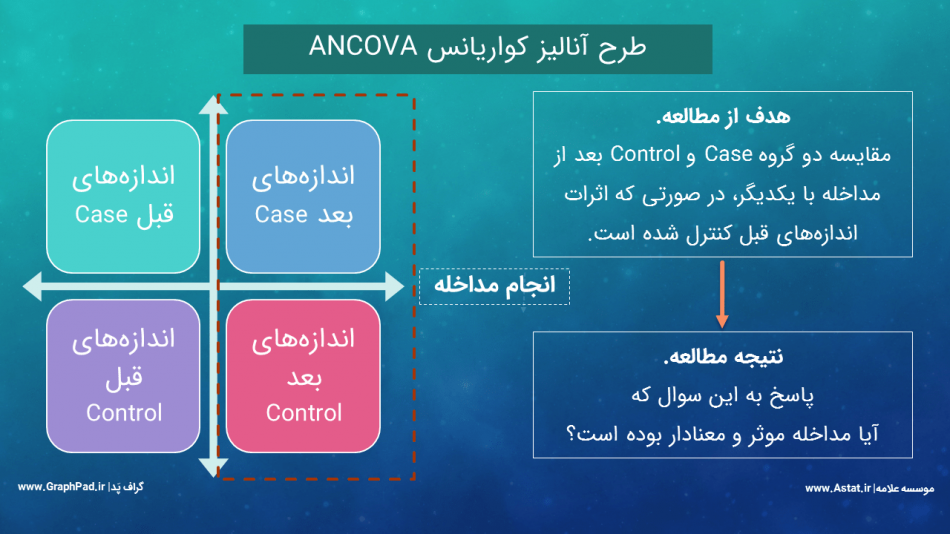
در آمار استنباطی مفهومی به نام آنالیز کوواریانس وجود دارد که به حذف اثرات کمیتهای مداخلهگر Intervener Variables جهت بیان نتایج با دقت بیشتر، میپردازد. آنالیز کوواریانس مدل پیشرفتهتر آنالیز واریانس میباشد، هنگامی که از تحلیلهای رگرسیونی نیز استفاده میکنیم. تحلیل کوواریانس مناسبترین آزمون آماری برای طرح پیش آزمون و پس آزمون دو گروهی است.
مجموعه آموزش آنالیز کوواریانس دو طرفه Two-way ANCOVA
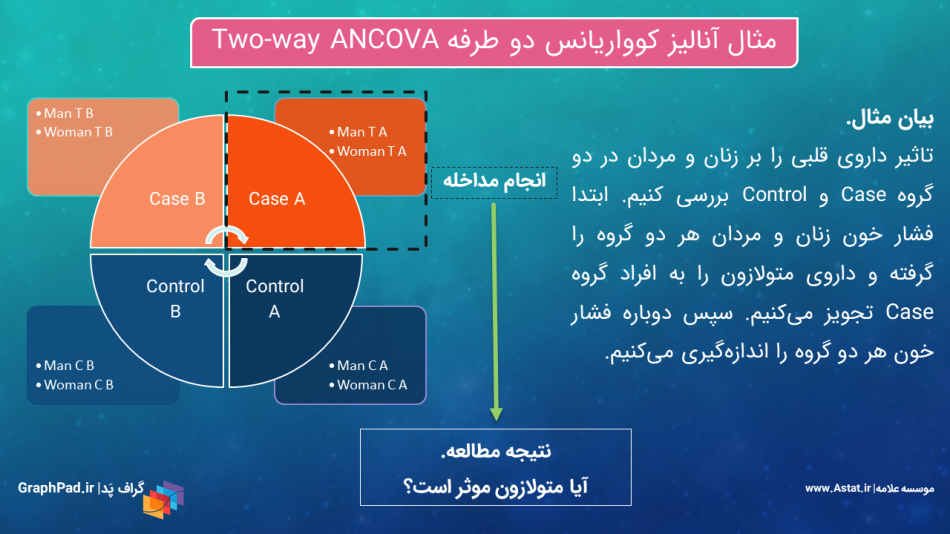
تحلیل کوواریانس دو طرفه یا Two-way ANCOVA هنگامی مورد استفاده قرار میگیرد که بخواهیم یک کمیت وابسته Dependent Variable را در بین گروههای مستقل بیش از یک فاکتور Factor، در حالیکه در مطالعه کمیت مداخلهگر کووریت Covariate داریم، مورد مقایسه قرار دهیم. آنالیز کوواریانس دو طرفه Two-way ANCOVA در این مجموعه با استفاده از روش General Linear Model, Univariate آموزش داده شده است.
مجموعه آموزش آنالیز کوواریانس چندگانه یک طرفه One-way MANCOVA
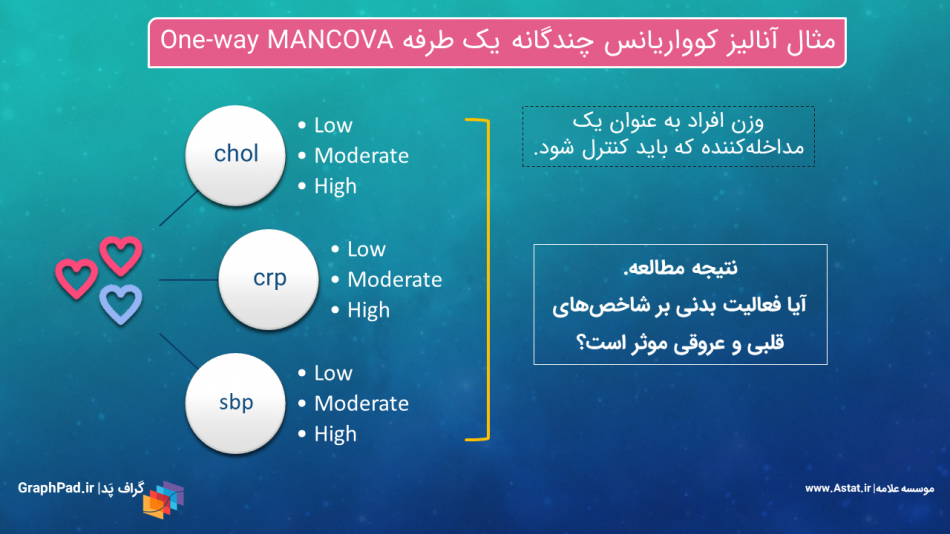
تحلیل کوواریانس چندگانه یک طرفه یا One-way MANCOVA هنگامی مورد استفاده قرار میگیرد که بخواهیم بیش از یک کمیت وابسته Dependent Variables را در بین گروههای مستقل یک فاکتور Factor مورد مقایسه قرار دهیم، در حالی که در مطالعه یک مداخله کننده یعنی کووریت Covariate وجود دارد. آنالیز کوواریانس چندگانه یک طرفه در این مجموعه با استفاده از روش General Linear Model, Multivariate آموزش داده شده است.
مجموعه آموزش آنالیز کوواریانس چندگانه دو طرفه Two-way MANCOVA
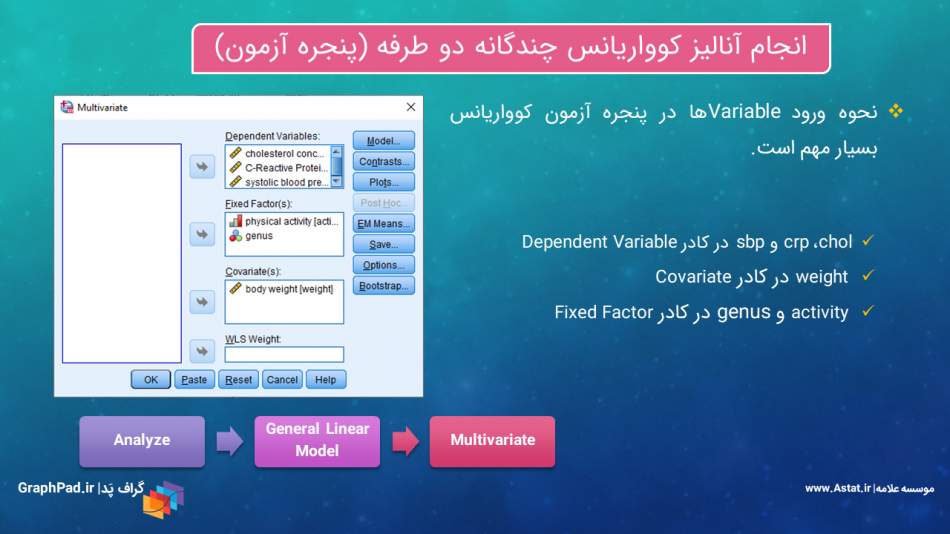
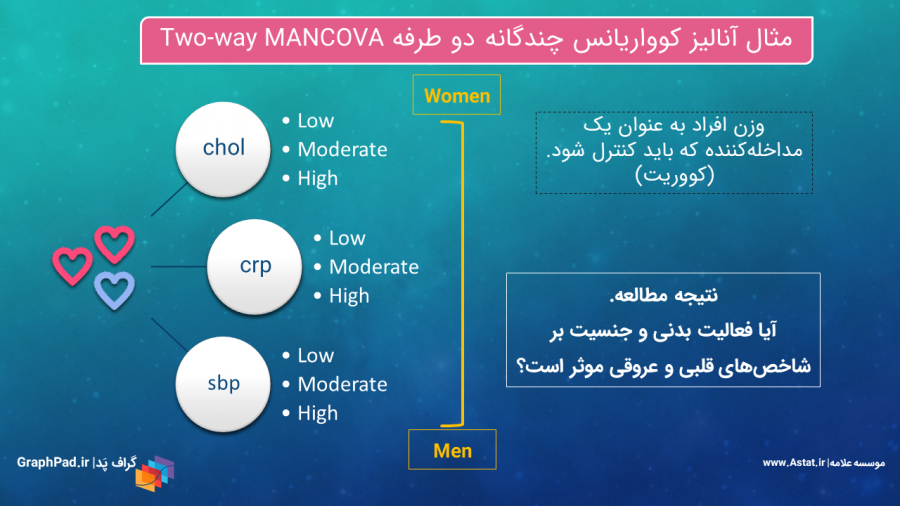
تحلیل کوواریانس چندگانه دو طرفه یا Two-way MANCOVA هنگامی مورد استفاده قرار میگیرد که بخواهیم بیشتر از یک کمیت وابسته Dependent Variable را در بین گروههای مستقل بیش از یک فاکتور Factor، در حالیکه در مطالعه کمیت مداخلهگر کووریت Covariate داریم، مورد مقایسه قرار دهیم. آنالیز کوواریانس چندگانه دو طرفه در این مجموعه با استفاده از روش General Linear Model, Multivariate آموزش داده شده است.
مجموعه آموزش آنالیز کوواریانس ANCOVA و MANCOVA یک طرفه و دو طرفه
آنالیز کوواریانس Analysis of Covariance به حذف اثرات کمیتهای مداخله گر Intervener Variables میپردازد و مدل پیشرفتهتر آنالیز واریانس میباشد، هنگامی که از تحلیلهای رگرسیونی نیز استفاده میکنیم و در مطالعه مداخله کننده یعنی کووریت Covariate وجود دارد. تحلیل کوواریانس مناسبترین آزمون آماری برای طرح پیش آزمون و پس آزمون میباشد. در این مجموعه انواع تحلیل کوواریانس یک بعدی و چندگانه یک طرفه و دو طرفه بیان شده و با استفاده از روش General Linear Model آموزش داده شده است.
تماس و مشاوره با گرافپد
گستردگی انواع تحلیلهای آماری موجود در گراف پد را ببینید
Statistical Comparisons
- Paired or unpaired t tests. Reports P values and confidence intervals
- Automatically generate volcano plot (difference vs. P value) from multiple t test analysis
- Nonparametric Mann-Whitney test, including confidence interval of difference of medians
- Kolmogorov-Smirnov test to compare two groups
- Wilcoxon test with confidence interval of median
- Perform many t tests at once, using False Discovery Rate (or Bonferroni multiple comparisons) to choose which comparisons are discoveries to study further
- Ordinary or repeated measures ANOVA followed by the Tukey, Newman-Keuls, Dunnett, Bonferroni or Holm-Sidak multiple comparison tests, the post-test for trend, or Fisher’s Least Significant tests
- One-way ANOVA without assuming populations with equal standard deviations using Brown-Forsythe and Welch ANOVA, followed by appropriate comparisons tests (Games-Howell, Tamhane T2, Dunnett T3)
- Many multiple comparisons test are accompanied by confidence intervals and multiplicity adjusted P values
- Greenhouse-Geisser correction so repeated measures one-, two-, and three-way ANOVA do not have to assume sphericity. When this is chosen, multiple comparison tests also do not assume sphericity
- Kruskal-Wallis or Friedman nonparametric one-way ANOVA with Dunn’s post test
- Fisher’s exact test or the chi-square test. Calculate the relative risk and odds ratio with confidence intervals
- Two-way ANOVA, even with missing values with some post tests
- Two-way ANOVA, with repeated measures in one or both factors. Tukey, Newman-Keuls, Dunnett, Bonferroni, Holm-Sidak, or Fisher’s LSD multiple comparisons testing main and simple effects
- Three-way ANOVA (limited to two levels in two of the factors, and any number of levels in the third)
- Analysis of repeated measures data (one-, two-, and three-way) using a mixed effects model (similar to repeated measures ANOVA, but capable of handling missing data)
- Kaplan-Meier survival analysis. Compare curves with the log-rank test (including test for trend)
- Comparison of data from nested data tables using nested t test or nested one-way ANOVA (using mixed effects model)
Nonlinear Regression
- Fit one of our 105 built-in equations, or enter your own. Now including family of growth equations: exponential growth, exponential plateau, Gompertz, logistic, and beta (growth and then decay)
- Enter differential or implicit equations
- Enter different equations for different data sets
- Global nonlinear regression – share parameters between data sets
- Robust nonlinear regression
- Automatic outlier identification or elimination
- Compare models using extra sum-of-squares F test or AICc
- Compare parameters between data sets
- Apply constraints
- Differentially weight points by several methods and assess how well your weighting method worked
- Accept automatic initial estimated values or enter your own
- Automatically graph curve over specified range of X values
- Quantify precision of fits with SE or CI of parameters. Confidence intervals can be symmetrical (as is traditional) or asymmetrical (which is more accurate)
- Quantify symmetry of imprecision with Hougaard’s skewness
- Plot confidence or prediction bands
- Test normality of residuals
- Runs or replicates test of adequacy of model
- Report the covariance matrix or set of dependencies
- Easily interpolate points from the best fit curve
- Fit straight lines to two data sets and determine the intersection point and both slopes
Simulations
- Simulate XY, Column or Contingency tables
- Repeat analyses of simulated data as a Monte-Carlo analysis
- Plot functions from equations you select or enter and parameter values you choose
Principal Component Analysis (PCA)
- Component selection via Parallel Analysis (Monte Carlo simulation), Kaiser criterion (Eigenvalue threshold), Proportion of Variance threshold, and more
- Automatically generated Scree Plots, Loading Plots, Biplots, and more
- Use results in downstream applications like Principal Component Regression
Multiple Variable Graphing
- Specify variables defining axis coordinates, color, and size
- Create Bubble Plots
Column Statistics
- Calculate descriptive statistics: min, max, quartiles, mean, SD, SEM, CI, CV, skewness, kurtosis
- Mean or geometric mean with confidence intervals
- Frequency distributions (bin to histogram), including cumulative histograms
- Normality testing by four methods (new: Anderson-Darling)
- Lognormality test and likelihood of sampling from normal (Gaussian) vs. lognormal distribution
- Create QQ Plot as part of normality testing
- One sample t test or Wilcoxon test to compare the column mean (or median) with a theoretical value
- Identify outliers using Grubbs or ROUT method
- Analyze a stack of P values, using Bonferroni multiple comparisons or the FDR approach to identify “significant” findings or discoveries
Simple Linear Regression and Correlation
- Calculate slope and intercept with confidence intervals
- Force the regression line through a specified point
- Fit to replicate Y values or mean Y
- Test for departure from linearity with a runs test
- Calculate and graph residuals in four different ways (including QQ plot)
- Compare slopes and intercepts of two or more regression lines
- Interpolate new points along the standard curve
- Pearson or Spearman (nonparametric) correlation
Generalized Linear Models (GLMs)
- Generate models relating multiple independent variables to a single dependent variable using the new multiple variables data table
- Multiple linear regression (when Y is continuous)
- Poisson regression (when Y is counts; 0, 1, 2, …)
- Logistic regression (when Y is binary; yes/no, pass/fail, etc.)
Clinical (Diagnostic) Lab Statistics
- Bland-Altman plots
- Receiver operator characteristic (ROC) curves
- Deming regression (type ll linear regression)
Other Calculations
- Area under the curve, with confidence interval
- Transform data
- Normalize
- Identify outliers
- Normality tests
- Transpose tables
- Subtract baseline (and combine columns)
- Compute each value as a fraction of its row, column or grand total
